SimBuddy Get SimBuddy

Find the hang. Name the line.

Start profiling and SimBuddy relaunches the app with its probe, or joins a Run from Xcode without a relaunch. Every hang shows the line the main thread waited on, and leaks and growing memory name the type that made them.

Free: three profiler sessions a day, 30 minutes each.Pro: no daily limit.

The Profiler film. 1:31, with sound.

A tap freezes SimBuddyDemo, and the Profiler names the 1528 ms hang in ProfilerLabModel.waitForLock() at ProfilerLab.swift:168. Then a sample of an update storm, a leak with the line that allocated it, and what keeps a cache alive.

Music: Sascha Ende, ende.app (CC BY 4.0). Sound effects: Kenney (CC0).

Watch it live.

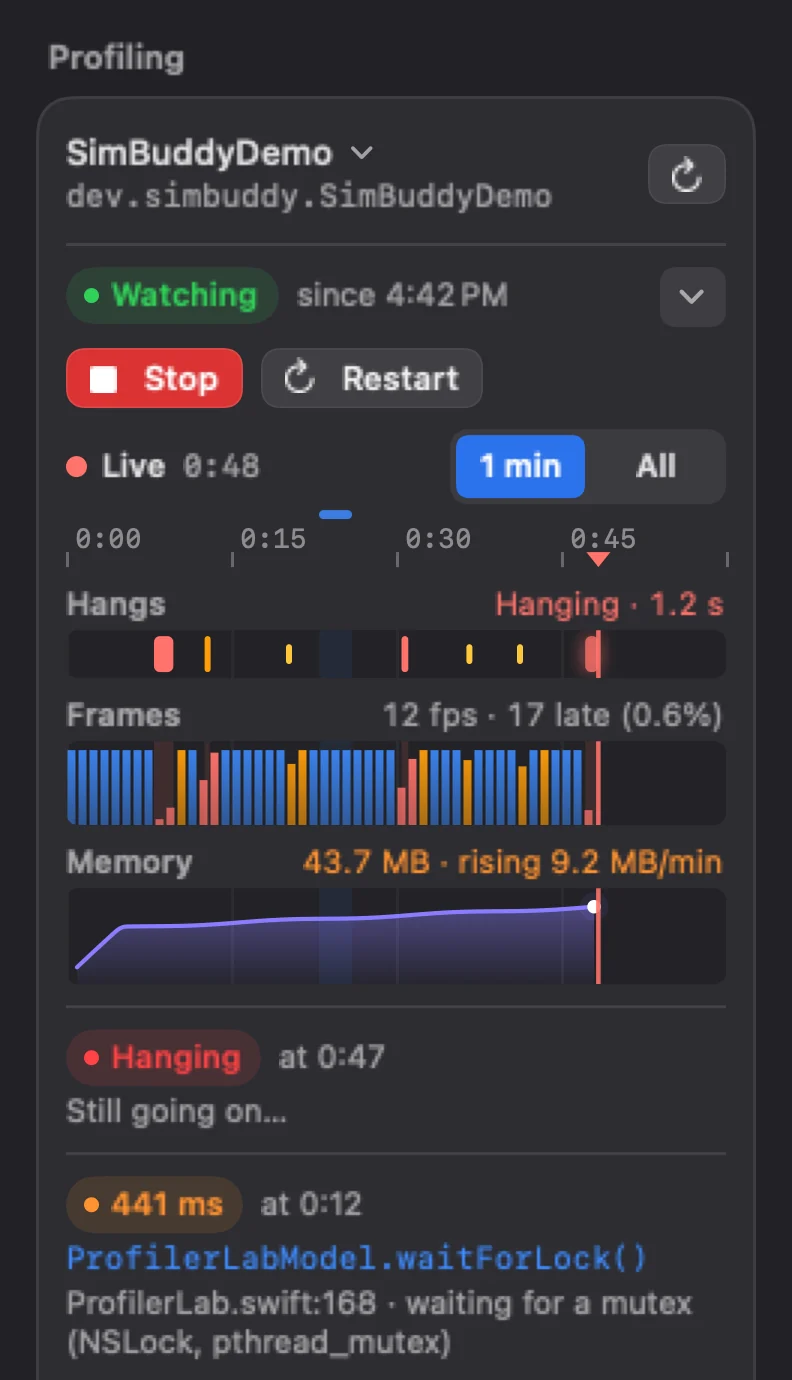
The timeline draws hangs, late frames and memory while you use the app. Anything that holds the main thread for 250 ms or more is a hang, and 100 to 249 ms a stall.

When a hang ends, it names the function and the line it was stuck in: here, a lock in ProfilerLab.swift at line 168.
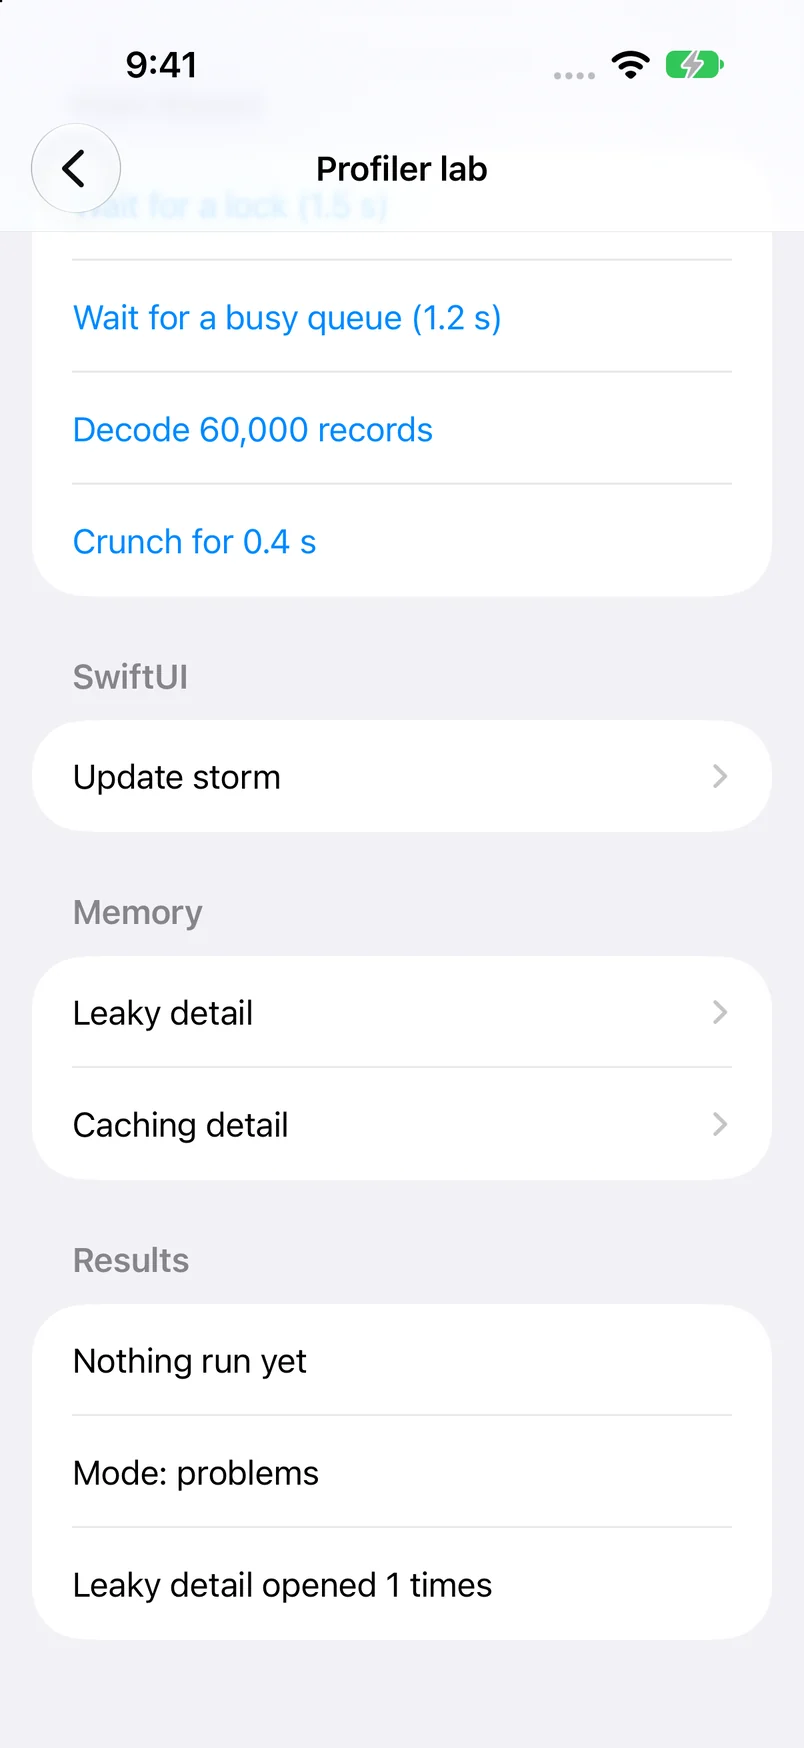
SimBuddyDemo’s Profiler lab on iPhone 18 Pro: buttons that wait for a busy queue, decode 60,000 records and open a leaky screen
The Profiler workspace watching SimBuddyDemo: a live timeline of hangs, frames and memory rising 9.2 MB a minute, and a 441 ms hang in ProfilerLabModel.waitForLock()
SimBuddyDemo’s Profiler lab, and the panel watching it.

Leaks, after you close the screen.

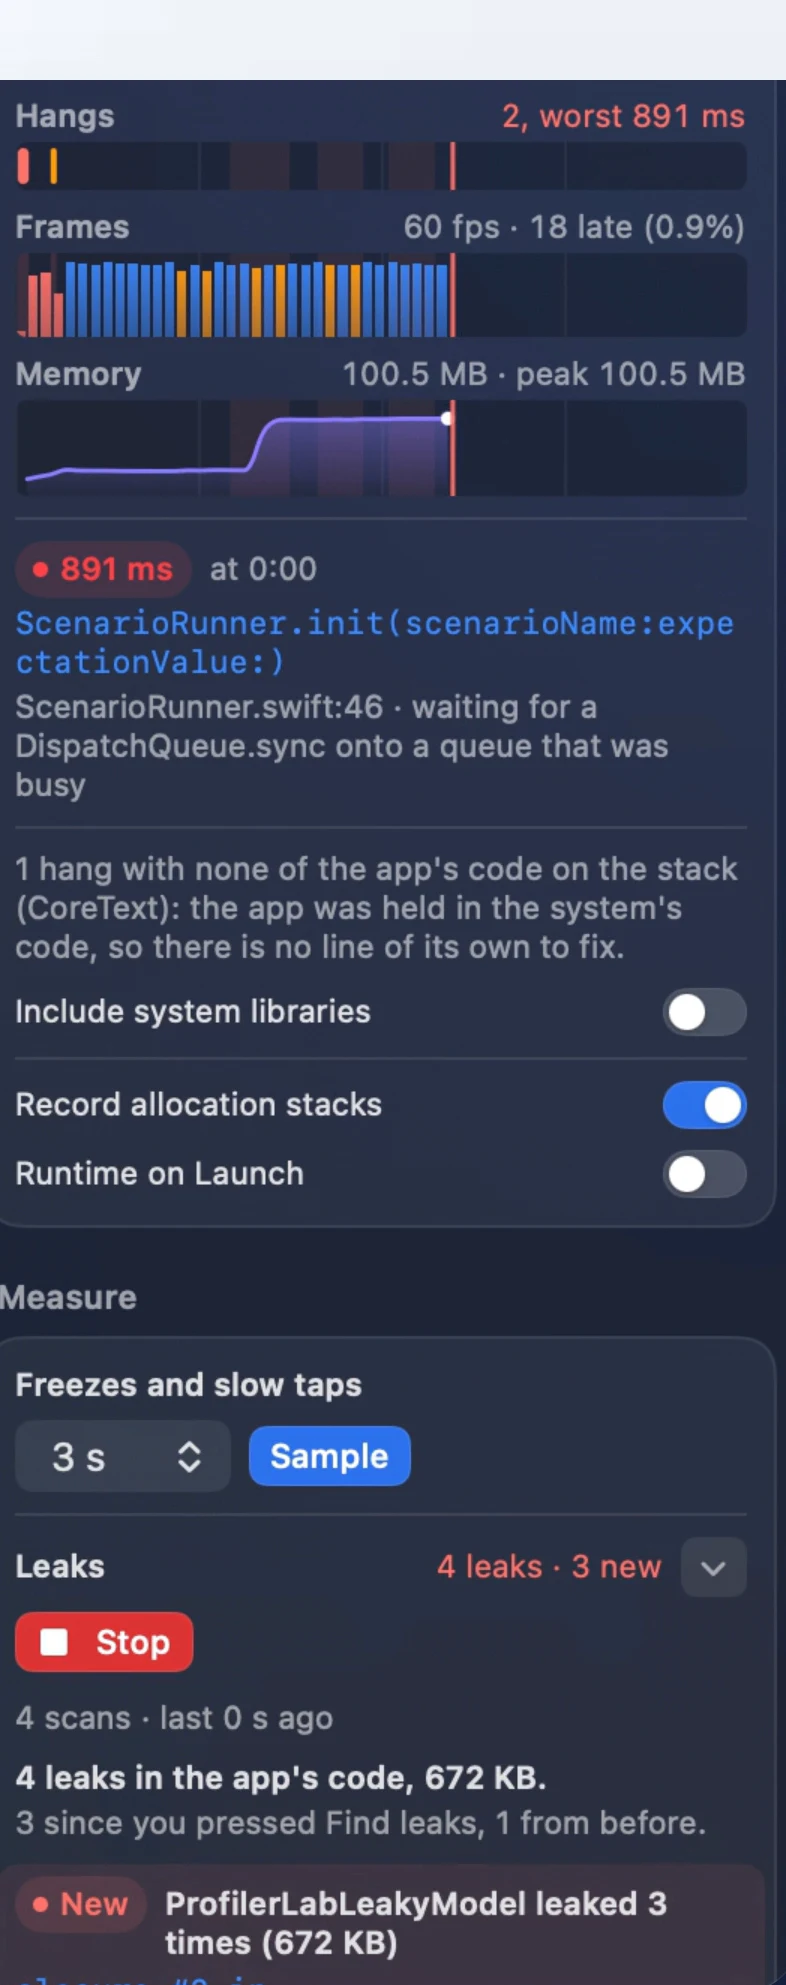
Press Find leaks, then open and close the screen you suspect. SimBuddy keeps watching: each new leak shows up by type and, with allocation stacks on, with the line that allocated it.

For memory that is still referenced but keeps growing, take a Baseline, repeat the interaction and Compare.

  • Copy for agent puts the findings on the clipboard as text
  • The system’s own leaks are counted apart
  • Allocation stacks slow the app a little, so time hangs without them
The Profiler workspace on iPhone 18 Pro while Find leaks keeps watching: the Hangs, Frames and Memory timeline, Record allocation stacks on, and Leaks: 4 leaks, 3 new, ProfilerLabLeakyModel leaked 3 times (672 KB)

SwiftUI, and the whole picture.

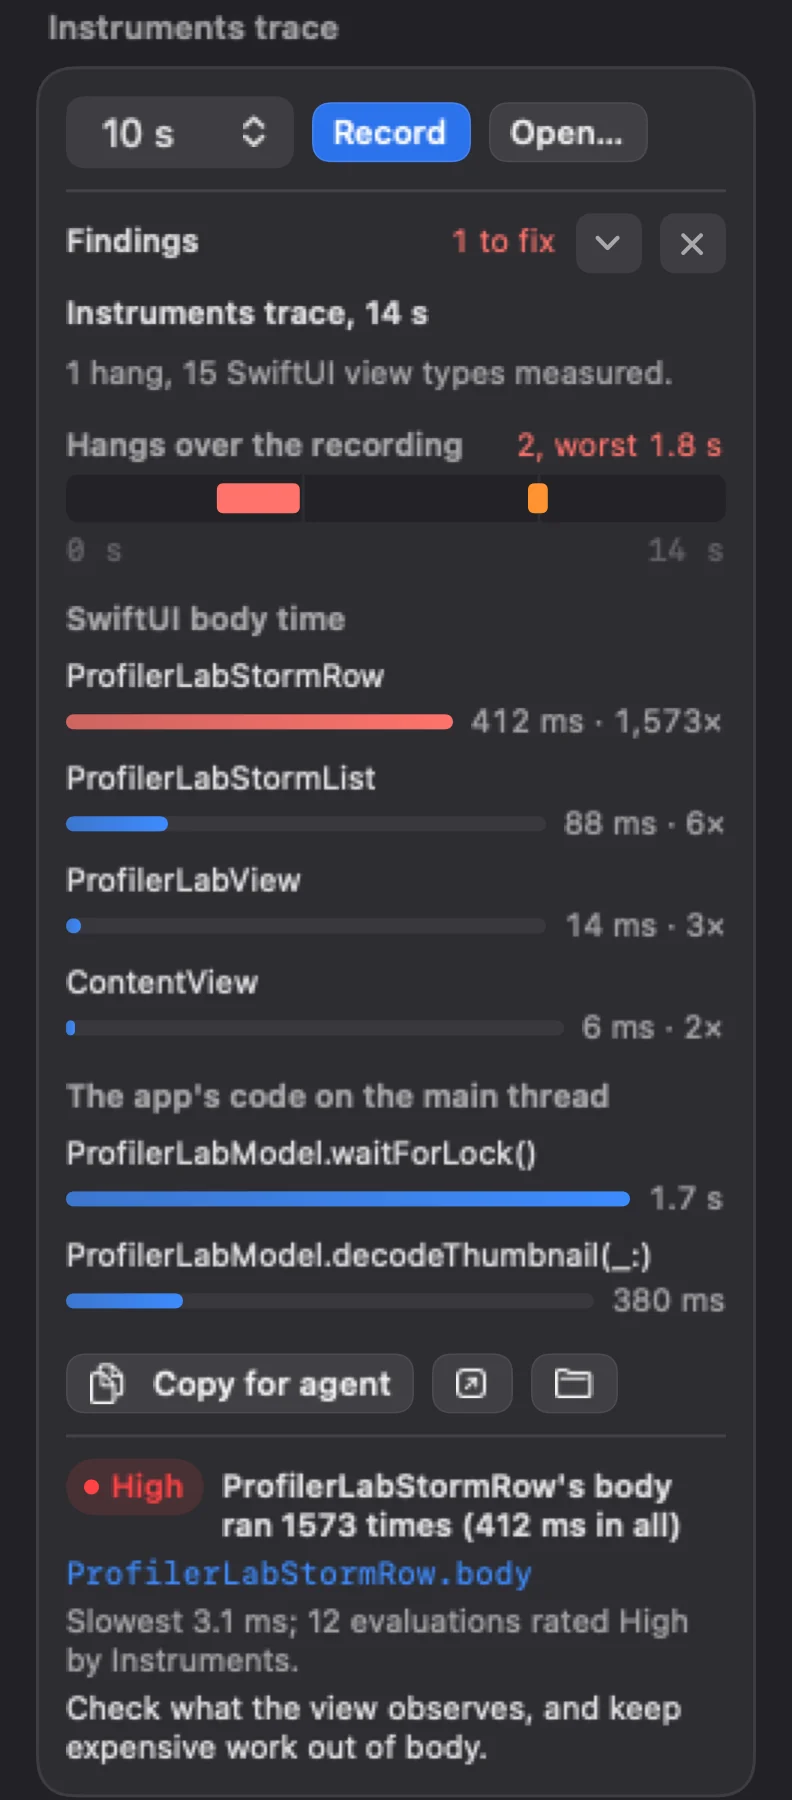
Record an Instruments trace and SimBuddy reads it for you: which view’s body ran most, for how long, and which of the app’s functions held the main thread.

SimBuddy from the App Store gives you the Terminal command to record the trace, then reads it from the SimBuddy folder.

Findings from a 14 second Instruments trace: SwiftUI body time by view, the app’s code on the main thread, and a High finding for ProfilerLabStormRow’s body

Your agent can profile too.

Each command answers with findings an agent can act on, the same across runs, so it can fix a hang and check that it went.

$ simbuddy profiler start com.example.app --stack-logging

The probe and allocation stacks, so leaks name their line.

$ simbuddy profiler hangs com.example.app

Every hang, stall and late frame since the start.

$ simbuddy profiler leaks com.example.app

After opening and closing the screen you suspect.